
Cape Coral 2025: Why Florida’s Canal City Is a Buyer’s Market Again
with Sun Belt demographics and Florida’s tax advantages—yet it’s also navigating a cyclical reset after the pandemic boom.-Rafael Benavente

By Rafael Benavente
Cape Coral in 2025: A Pragmatic Investor’s Guide to Florida’s Canal City
Cape Coral, on Florida’s Gulf Coast, is a real estate market that rewards selectivity and discipline. It pairs a unique waterfront lifestyle (more than 400 miles of canals) with Sun Belt demographics and Florida’s tax advantages—yet it’s also navigating a cyclical reset after the pandemic boom, plus higher insurance and holding costs. For investors who underwrite conservatively, Cape Coral can still pencil: entry prices have softened, rents remain competitive regionally, and the city is investing in infrastructure while maintaining comparatively moderate millage rates. This guide distills the opportunities, risks, and actionable strategies for 2025.
Quick market snapshot (August 2025)
| Metric | Where it stands | Investor read |
|---|---|---|
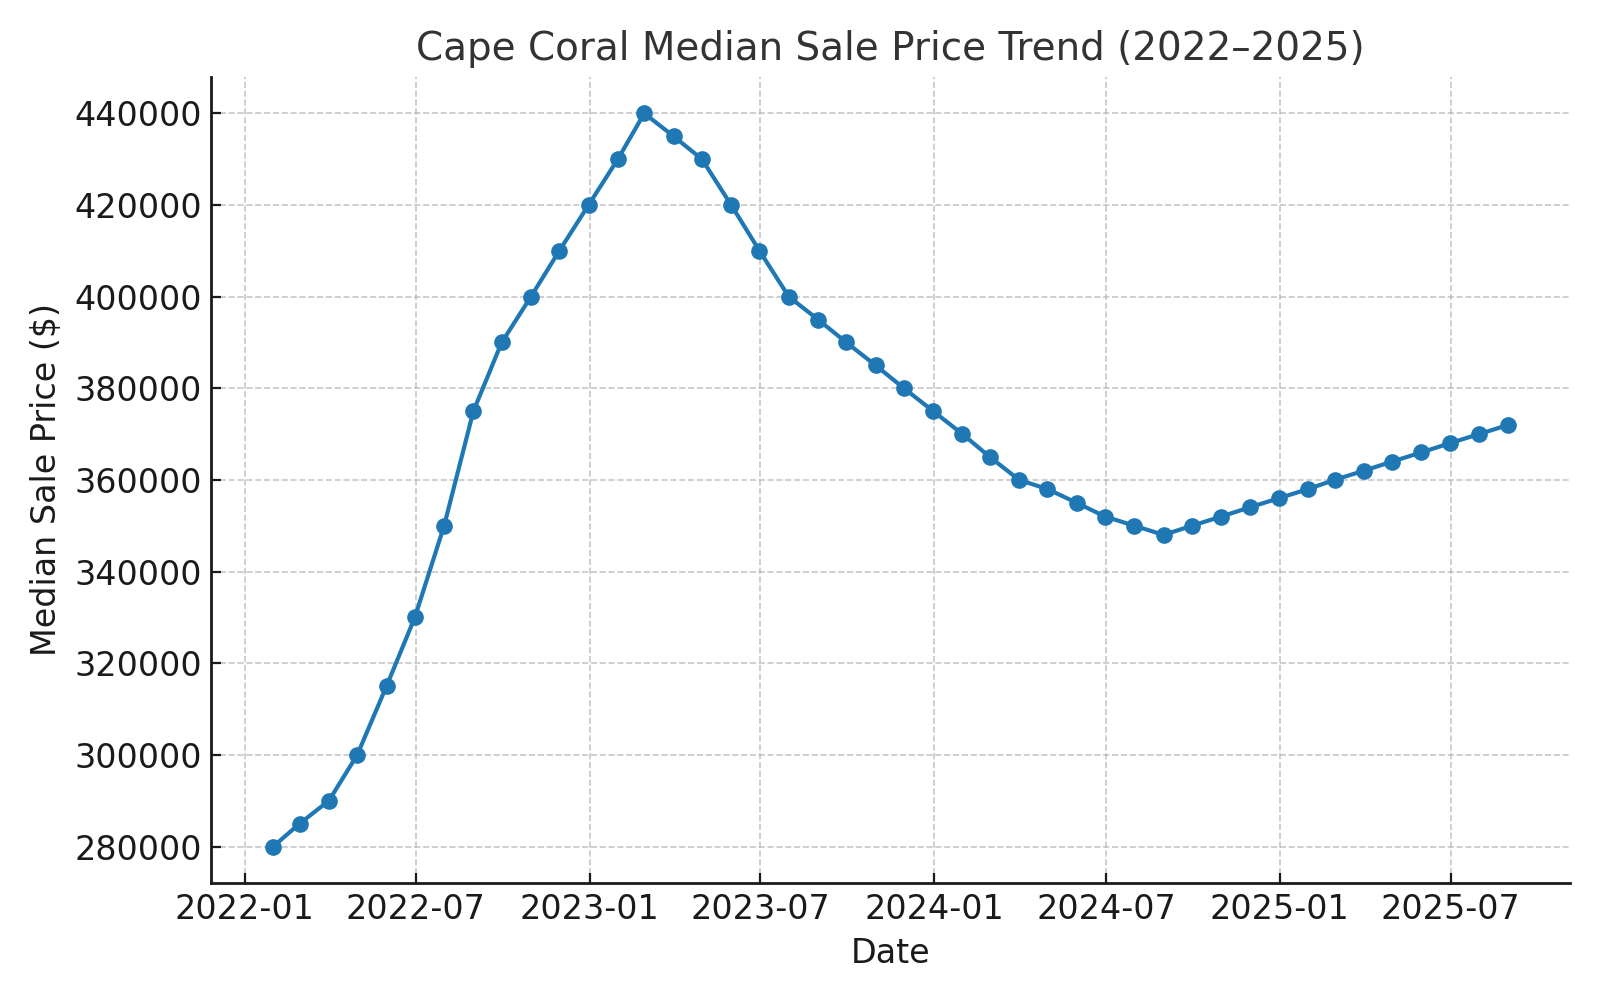
| Median sale price (city) | ~$350,000 (Jul–Aug 2025 range) | Down ~5–10% YoY; buyers hold more leverage. RedfinRocket Mortgage |
| Average home value (ZHVI) | ~$348,000 | ~9–10% YoY decline; values take longer to go pending (~2–3 months). Zillow |
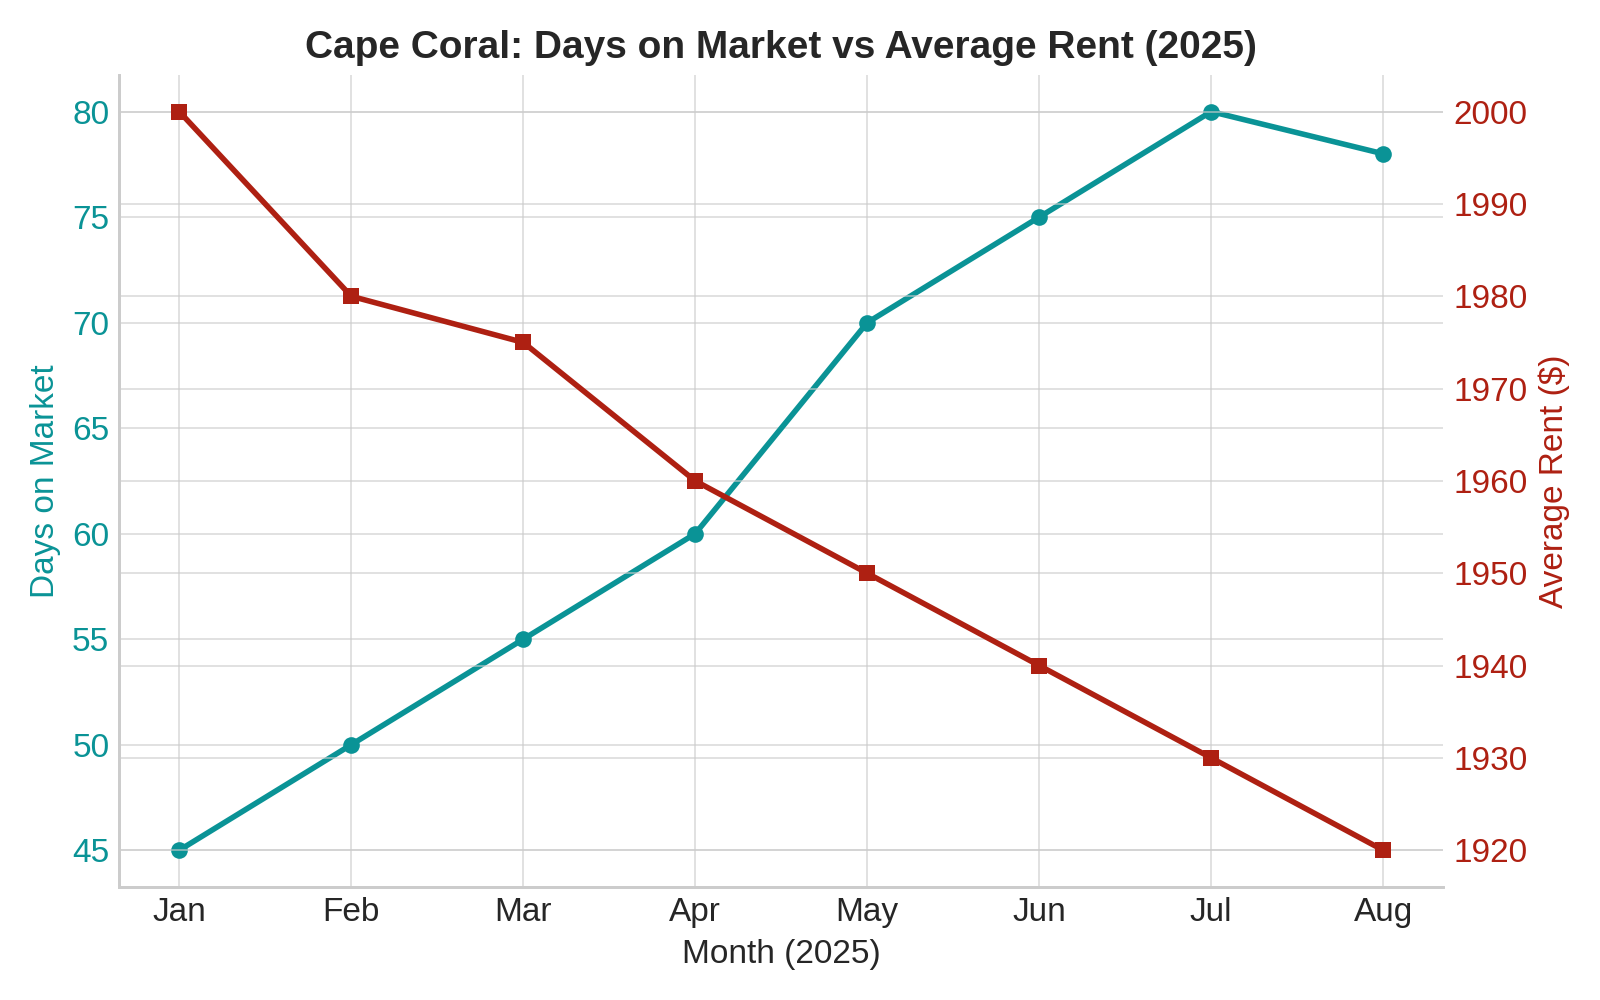
| Days on market | ~75–88 days | Longer marketing times; room to negotiate. ZillowRedfin |
| Average rent (all types) | ~$1,600–$2,050/month (source-dependent) | Healthy rent base vs. purchase prices; variation by property type. Zumper - Apartments for Rent & HousesZillow |
| Property tax rate (millage) | 5.2188 mills adopted for FY2025 | Competitive within FL cities of similar size; council monitoring 2026 options. Cape CoralCape Coral Breeze |
| Population trend (metro) | ~975k MSA; steady growth | Demographic support for long-term demand. MacrotrendsFRED |
Bottom line: Prices have cooled more than in many Florida markets, inventory is deeper, and rents haven’t collapsed. That combination can produce workable yields when you buy right and budget for insurance.
Demand fundamentals: why Cape Coral still draws residents and capital
Population growth: The broader Cape Coral–Fort Myers metro continues to expand, with the MSA reaching roughly 975,000 residents in 2025, up ~1.9% from 2024. City-level estimates show Cape Coral itself above 240,000 residents, reflecting double-digit growth since 2020. Migration slowed from peak-pandemic levels, but the multi-year trajectory remains positive. MacrotrendsFREDWorld Population ReviewFlorida Demographics
Lifestyle and logistics: Cape Coral’s grid of saltwater and freshwater canals, proximity to beaches (Sanibel, Captiva), and access to employment nodes in Fort Myers/Naples help underpin owner-occupier and retiree demand. The inventory of single-family homes—many with pools and three-car garages—supports family and relocator profiles, while new build product continues to trickle in as post-Ian reconstruction normalizes permitting. The city has also rolled out tools like the Forerunner flood-risk portal to increase transparency for homeowners and buyers. Cape Coral
Taxes and city investment: In October 2024 the city approved the FY2025 budget with a millage rate of 5.2188, trimming the rate while funding public safety and infrastructure—signals of pro-growth fiscal management. Mid-2025 budget discussions kept options open for 2026, highlighting that new construction is a key revenue driver—relevant for infill and build-for-rent strategies. Cape CoralCape Coral Breeze
Price action: from boom to balance
Cape Coral was a pandemic rocket ship…and then reality set in. The median sale price sits near $350,000, down ~5–10% year-over-year depending on the data source, and homes take ~75–88 days to sell on average. Research outlets also note widespread price cuts, with national papers flagging Cape Coral/Fort Myers among the sharpest Sun Belt cool-downs as inventories rise and insurance weighs on affordability. For investors, that means a more rational entry window—if you underwrite thoughtfully. RedfinRocket MortgageZillowThe Washington Post
Some national coverage has labeled Cape Coral “the worst housing market” in 2025, citing overhang from rapid 2020–2022 appreciation and carrying-cost friction. Sensational headlines aside, the takeaway is useful: don’t pay 2022 prices in a 2025 market. Be disciplined on basis, capex, and risk premiums; the bid-ask gap favors patient buyers. The Wall Street Journal
Rental economics: stabilizing—and still investable with the right product
Rents vary by source and product type, but as of August 2025 you’ll commonly see apartment averages around $1,600–$1,800, with Zillow’s cross-type average near ~$2,050 (houses carry a premium). Year-over-year, several trackers show flat to modest declines, consistent with supply catching up and demand normalizing. For investors, the spread between achievable rent and today’s softened purchase prices can still deliver mid-single-digit unlevered yields on low-basis acquisitions, higher with light value-add. Zumper - Apartments for Rent & HousesApartments.comRentCafeZillow
What rents best now?
- Turn-key 3/2 houses with garages and lanai/pool in family-oriented neighborhoods remain the most liquid long-term rentals (LTRs).
- Newer construction (2018+) tends to lower maintenance and insurance friction.
- Canal homes command premiums but scrutinize flood elevations, seawall condition, and insurance quotes (see risk section).
- Condos/townhomes can work, but HOA fees and restrictions vary widely—underwrite them as a “second mortgage.”
Insurance, climate, and other carrying costs (the big investor diligence)
No Florida investment memo is complete without insurance. The state’s homeowners’ insurance market has been volatile; premiums surged 2022–2024, and while some signs point to stabilization or modest decreases in 2025 (e.g., OIR’s stability report, Citizens’ rate moves), outcomes remain highly property-specific by age, roof type, elevation, and distance to water. County-level snapshots show Lee County’s average premium materially lower than coastal outliers like Monroe or Palm Beach, but still above national norms. Budget conservatively and quote early—before you offer. Florida Realtorswaybetterinsurance.com
Context from broader reporting (Florida and nationwide) reinforces the theme: higher reinsurance costs, climate-driven losses, and policy non-renewals have stressed affordability. The macro narrative explains buyer hesitation—and supports your negotiating leverage today. VoxMarketWatch
Practical underwriting tips:
- Get multiple quotes (admitted + surplus lines), price with and without wind mitigation credits.
- Order a four-point and wind-mit report during inspection; roof age and clips/straps matter.
- Run the city’s flood-risk data (BFE, DFE) via Forerunner; price NFIP vs. private flood with replacement-cost realism. Cape Coral
- Escrow for seawall/dock if canal-front; replacement costs can be six figures depending on exposure.
Post-Ian rebuild and permitting: where we are now
Hurricane Ian (Sept 2022) forced a wave of rebuild, repair, and elevation activity. The city’s open data shows extensive permitting for like-for-like replacements (e.g., screen enclosures) and structural rehab continuing through 2024–2025, helping normalize housing stock and contractor availability. For investors, this means more renovated inventory coming online and fewer extreme post-storm premiums on labor and materials than in 2023. Still, factor longer lead times for specialty trades. capecoral-capegis.opendata.arcgis.com
Lee County’s 2025 CDBG-DR Action Plan details remaining unmet needs for housing recovery—useful context for neighborhood-level differences in resilience and public funding focus. Investors who align with these flows (e.g., infill workforce housing) can benefit from improving block-level fundamentals. Lee County Government
Where the numbers tend to work (submarket notes)
- SW & SE Cape (south of Pine Island Rd.)
Established neighborhoods, many 1980s–2000s houses. Canal homes vary between saltwater (Gulf access via spreader canals/locks) and freshwater lakes/canals. Rents and resale liquidity are stronger here; insurance may be higher near open water or older roofs/elevations. - NE Cape (east of Del Prado, north of Pine Island Rd.)
Rapid infill with a large stock of 2016–2024 builds on standard 80’ x 125’ lots. This is a sweet spot for LTRs: newer roofs/systems, predictable floorplans, and modest yard/pool maintenance. Watch for ongoing utility assessments when underwriting. - NW Cape / Burnt Store corridor
Larger lots, newer construction, some acreage and planned amenities. Attractive for build-for-rent or small portfolios of similar homes for operational efficiency. Factor drive times and the tenant profile (often telework or retirees).
Asset selection checklist: newer roof & mechanicals; wind mitigation; elevation relative to BFE; HOA restrictions (if any); no unpermitted additions; clean four-point; realistic rent comps within 1–2 miles.
Strategies that make sense in 2025
1) Value-Buy LTRs (3/2/2 pool homes)
Target cosmetically tired but structurally sound 1998–2015 builds with newer roofs or credits for wind mitigation. Budget $20k–$40k for paint, flooring, fixtures, appliances, landscape, and lanai refresh. Aim for all-in basis that supports a 6–7% unlevered yield on today’s rents; lock fixed-rate debt with a refinance case if rates ease.
2) Newer-Build Micro-Portfolio (2018+)
Acquire 3–8 homes within a 1–3-mile radius to streamline leasing and maintenance. Newer roofs, impact windows, and modern codes help on insurance and reduce capex surprises—key in Florida.
3) Canal-Front Premiums—But Only with Discipline
Focus on homes above BFE with wind-mit credits and documented seawall stability. Target freshwater systems for better numbers or Gulf-access only when pricing discounts reflect carrying costs. Do not assume short-term rental (STR) economics; Cape Coral permits STRs, but competition and seasonality make conservative LTR underwriting safer.
4) Build-for-Rent (Selectively)
Rising labor/materials costs and softening sale comps challenge merchant-build margins, but BTR pencil can work if you secure lots at discounts and standardize plans. Emphasize 1,400–1,900 sq ft 3/2s with 2-car garages, durable finishes, and sprinkler/landscape packages optimized for low maintenance.
Risk controls you can’t skip
- Insurance first, not last. Price homeowners + wind + flood during diligence. Model a sensitivity range (base case +15–25%). Florida RealtorsVox
- Flood and elevation. Obtain elevation certificates when unclear; compare to DFE and current maps. Cape Coral
- Seawalls & docks. Require recent inspections; escrow or price in future replacement.
- Utilities & assessments. Verify water/sewer/irrigation assessments; they can materially change monthly outflows.
- HOA/condo health. For attached product, read budgets, reserves, and special-assessment history. Florida condo law changes after Surfside increased reserve requirements—great for safety, not always for cash flow.
- Exit liquidity. Favor floorplans and neighborhoods with strong owner-occupant demand; that’s your best exit in any market.
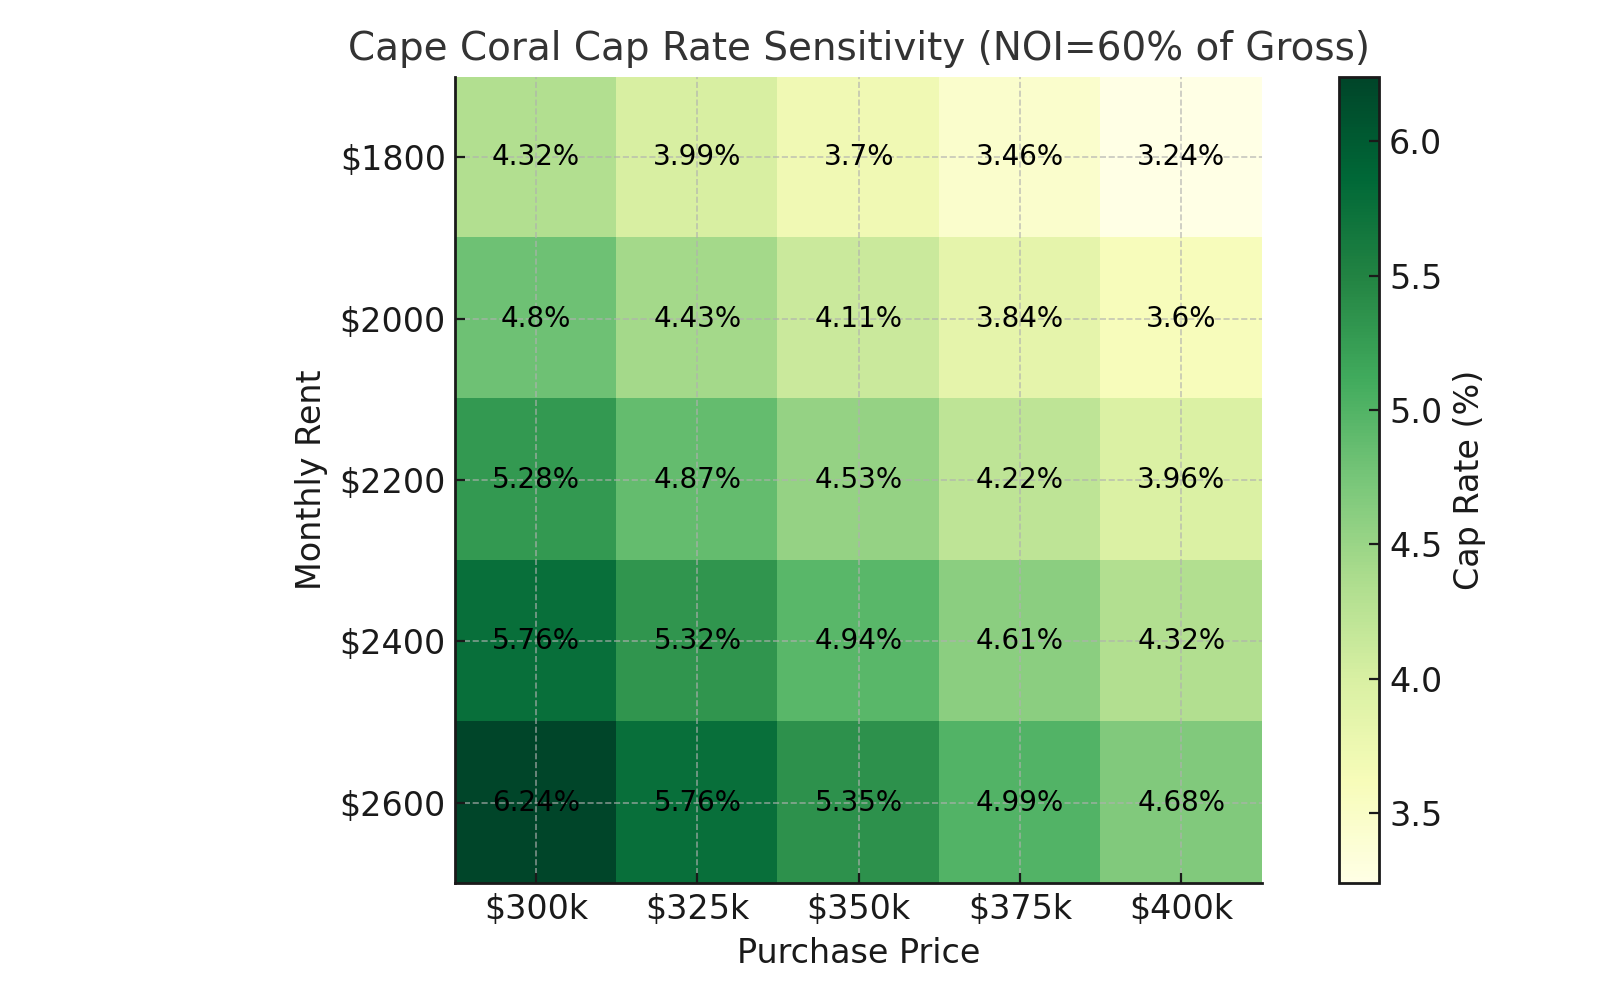
Pro forma: what “good” looks like right now
Example: 2019-built 3/2/2, 1,650 sq ft in NE Cape on a standard lot (no pool).
- Purchase price: $335,000 (post-negotiation on days-on-market >60). Redfin
- Make-ready + closing: $12,000 (appliances, paint, light fixtures, landscaping, minor punch).
- All-in basis: ~$347,000.
- Market rent (house): $2,200–$2,400 (segment median skewed by apartments; houses lease higher). ZillowApartments.com
- Gross yield: 7.6–8.3%.
- Operating expenses: Taxes (~$1,800–$2,400 with homestead not applicable), insurance ($2,200–$3,200 depending on quotes and wind credits), repairs/turns (5–7%), PM (8–10%), HOA $0 (non-HOA area). Cape CoralFlorida Realtors
- Unlevered NOI margin: ~55–60% (conservative).
- Unlevered cap rate: ~4.2–5.0%.
- Levered IRR: Mid- to high-single digits with 60–65% LTV, improving if/when rates decline or rent growth resumes.
Note: Always substitute your actual insurance quotes and verify taxes with Lee County’s property appraiser and the city’s latest millage.
The contrarian case for Cape Coral in 2025
- Buy the dip, not the dream. After one of the sharpest run-ups in Florida, Cape Coral’s price discovery favors buyers. If you’re disciplined on basis, today’s reset is your friend. RedfinZillow
- Rents are resilient enough. Even with modest softness, rents have not cratered—and single-family houses still command healthy premiums over apartments, supporting workable yields at the right basis. ZillowZumper - Apartments for Rent & Houses
- City posture is pro-growth. Cape Coral lowered its 2025 millage while investing in core services and rolling out flood-risk tools, signaling a pragmatic stance that supports long-term livability and investor confidence. Cape Coral+1
- Demographics don’t vanish. The MSA keeps growing. People still move to Southwest Florida for climate, lifestyle, and taxes—just at a more sustainable pace. That’s good for long-term holders. MacrotrendsFRED
What could go wrong (and how to mitigate)
- Insurance backslides again. Lock quotes early, prioritize newer construction with strong wind mitigation, and consider higher deductibles paired with reserve buffers. Florida Realtors
- Another major storm. Focus on elevation, impact windows/doors, and roof age; prefer inland or freshwater-canal homes with favorable BFEs; maintain flood coverage. Cape Coral
- Oversupply/weak absorption. Stick to the most liquid product (3/2/2), avoid edge-case luxury specs, and buy where owner-occupant demand is deepest.
- HOA/condo special assessments. For condos, underwrite reserves and potential structural work; consider SFHs to reduce association risk.
- Policy shifts (taxes/fees). Track council millage decisions and utility assessment schedules; bake conservative escalators into underwriting. Cape Coral Breeze
Due diligence checklist (use before you offer)
- Insurance & flood: Two quotes minimum (admitted + surplus), wind-mit inspection, elevation certificate, NFIP vs. private flood pricing. Cape Coral
- Structural & systems: Four-point + full inspection; roof age, clips/straps, panel type, plumbing/HVAC.
- Seawall/dock (if canal): Inspection with photos and lifespan estimate.
- Title & permitting: Open permits or unpermitted work; confirm all post-Ian repairs were properly closed out. capecoral-capegis.opendata.arcgis.com
- Taxes & assessments: Verify millage, utility assessments, and TRIM notices. Cape Coral
- Rent comps: Use house comps within a tight radius; apartment indices can understate SFR potential. Zillow
Final take
Cape Coral is no longer the frenzy market of 2021–2022—and that’s precisely why it’s interesting again. The combination of lower entry prices, steady (if slower) demographic support, and a city signaling investment in services while maintaining competitive taxes creates a lane for investors who buy prudently and manage risk. Treat insurance like a first-class underwriting input, favor newer or well-mitigated homes, and let today’s longer days-on-market work in your favor.
If you execute on basis and risk controls, Cape Coral in 2025 can deliver the kind of boring, cash-flowing Florida exposure that holds up—without betting on a return to peak-pandemic exuberance.
By Rafael Benavente
Sources (key data points)
- City of Cape Coral FY2025 budget & millage details. Cape Coral
- Cape Coral housing prices and DOM (Redfin, Rocket Homes, Zillow ZHVI). RedfinRocket MortgageZillow
- Population trends (Macrotrends, FRED MSA series, city estimates). MacrotrendsFREDWorld Population Review
- Rental averages and trends (Zillow Rentals, Zumper, Apartments.com/RentCafe). ZillowZumper - Apartments for Rent & HousesApartments.comRentCafe
- Insurance context and 2025 stability signals (Florida Realtors/OIR; regional analysis). Florida Realtorswaybetterinsurance.com
- City flood-risk portal (Forerunner). Cape Coral
- National context on price cooling (Washington Post) and headline coverage on Cape Coral’s downturn (WSJ). The Washington PostThe Wall Street Journal
other articles from Rafael Benavente on Real Estate check this one out